1) ตรวจสอบ CPU
ตรวจสอบสถานะ CPU แบบรวม
top
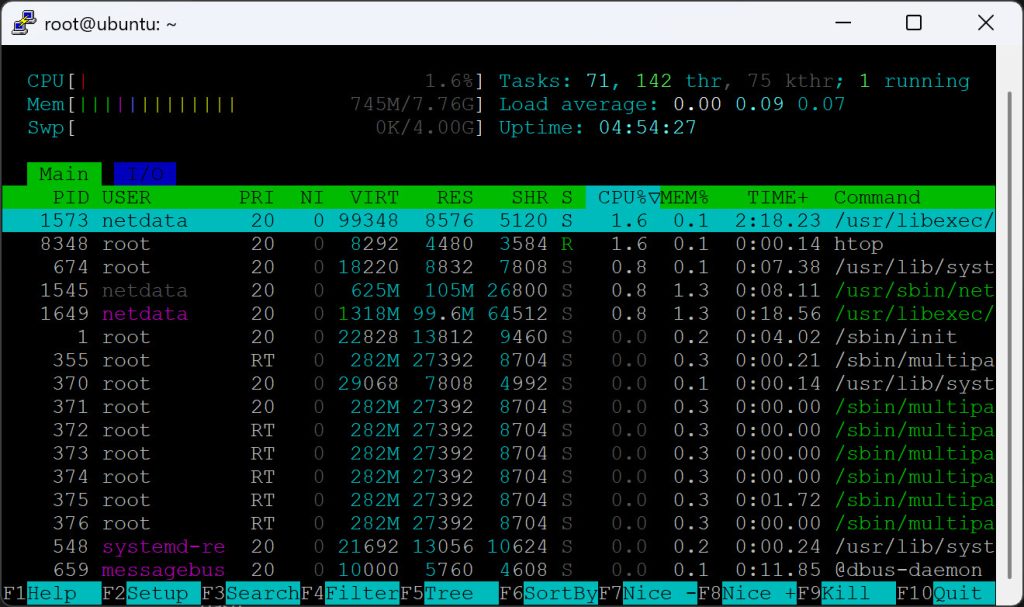
htop # (ต้องติดตั้งเพิ่ม) apt install htop
ดูสรุปจำนวน Core และความเร็ว
lscpu
cat /proc/cpuinfo
ดูโหลดเฉลี่ย (load average)
uptime
cat /proc/loadavg
2) ตรวจสอบหน่วยความจำ (RAM)
ดูการใช้งาน RAM / Swap แบบสรุป
free -h
ตรวจสอบ memory leak / process ใช้ RAM สูงสุด
top
ps aux --sort=-%mem | head
3) ตรวจสอบ Disk & File System
ตรวจสอบพื้นที่ใช้งาน Disk
df -h
ตรวจสอบการใช้งานโฟลเดอร์ย่อย
du -sh *
du -sh /var/log/*
ตรวจสอบ I/O ของ Disk (อ่าน/เขียน)
iostat -x 1 # ต้องติดตั้ง
sysstat
iotop # ตรวจสอบ Process ที่กิน I/O สูง
4) ตรวจสอบ Process และ Service
Process ที่ใช้ CPU สูงสุด
top
ps aux --sort=-%cpu | head
ตรวจสอบสถานะบริการ (Systemd)
systemctl status nginx
systemctl list-units --type=service
5) ตรวจสอบ Network
ตรวจสอบ Interface และ IP
ip a
ip r
ตรวจสอบการรับส่งข้อมูล (real-time)
nload # ต้องติดตั้งเพิ่ม apt install nload
iftop # ดู traffic ตาม IP/Port
ตรวจสอบการเชื่อมต่อ
ss -tulnp # แสดงพอร์ตที่เปิดอยู่
ss -antp # ดู TCP connections ทั้งหมด
ping 8.8.8.8
traceroute google.com
6) ตรวจสอบการใช้ทรัพยากรแบบสรุปในเครื่องเดียว
คำสั่งชุดนี้เหมาะสำหรับการดูภาพรวมของระบบในเสี้ยววินาที
สรุป CPU, Memory, Load, Disk, Network
vmstat 1
dstat # ต้องติดตั้ง
sar -u 1 3 # CPU
sar -r 1 3 # RAM
sar -n DEV 1 3 # Network
7) ตรวจสอบ Log System
ดู Log ล่าสุด
journalctl -xe
journalctl -u nginx
ดู Log ตามไฟล์
tail -f /var/log/syslog
tail -f /var/log/messages # บน CentOS/Rocky
8) ตรวจสอบ Hardware และอุณหภูมิ
Hardware Overview
lshw
lspci
lsblk
ตรวจสอบอุณหภูมิ CPU
sensors # ต้องติดตั้ง lm-sensors